


产生bin气象数据的随机方法分析
摘要
bin方法是一种众所周知且简捷的稳态的计算方法,可以用来预计建筑的冷热能耗。该方法需要可靠详细的bin数据。因为在中国长期的逐时温度记录不可用,故没有用来研究和应用的bin天气数据。为了让bin方法能在中国应用,在中国南京建立并验证了一种随机模型,通过提供日最高和最低气温该随机模型可以产生bin气象数据。与实测值进行比较,该模型产生的bin气象数据显示出很高的精确性。在那些长期逐时气温记录丢失或不可用的地区,特别是在中国,可以用该随机模型估算bin气象数据。
Keywords: Energy analysis; Stochastic method; Bin data; China
关键词:能耗分析;随机模型;Bin数据;中国
1.Introduction
1.绪论
In the sense of minimizing the life cycle cost of a building, energy analysis plays an important role in developing an optimum and cost effective design of a heating or an air conditioning system for a building. Several models are available for estimating energy use in buildings. These models range from simple steady state models to comprehensive dynamic simulation procedures.
为了最大限度减少建筑寿命周期内的费用,能耗分析在发展最适宜和成本更优化的建筑采暖和空调系统设计方面起到了很重要作用。这些模型涉及从简单稳定模型到复杂动态模拟程序。
Today, several computer programs, in which the influence of many parameters that are mainly functions of time are taken into consideration, are available for simulating both buildings and systems and performing hour by hour energy calculations using hourly weather data. DOE-2, BLAST and TRNSYS are such programs that have gained widespread acceptance as reliable estimation tools. Unfortunately, along with the increased sophistication of these models, they have also become very complex and tedious to use[1].
现今,一些电脑程序可用于模拟建筑和空调系统。这些程序使用逐时气象数据进行能耗计算,考虑了许多时间函数参数的影响。如DOE-2,BLAST and TRNSYS 就属此类程序,它们已经被当作可靠的估算工具得到广泛的认可。不足之处是,随着模型复杂性的增加,这些程序变得复杂而且使用起来十分冗长乏味。
The steady state methods, which are also called single measure methods, require less data and provide adequate results for simple systems and applications. These methods are appropriate if the utilization of the building can be considered constant. Among these methods are the degree day and bin data methods.
稳态方法,又称单测量法,只需要很少的数据且能够为简单的系统和应用提供足够的结论数据。其中有度日数法和bin数据法。
The degree-day methods are the best known and the simplest methods among the steady state models. Traditionally, the degree-day method is based on the assumption that on a long term average, the solar and internal gains will offset the heat loss when the mean daily outdoor temperature is 18.3℃ and that the energy consumption will be proportional to the difference between 18.3℃ and the mean daily temperature. The degree-day method can estimate energy consumption very accurately if the building use and the efficiency of the HVAC equipment are sufficiently constant. However, for many applications, at least one of the above parameters varies with time. For instance, the efficiency of a heat pump system and HVAC equipment may be affected directly or indirectly by outdoor temperature. In such cases, the bin method can yield good results for the annual energy consumption if different temperature intervals and time periods are evaluated separately. In the bin method, the energy consumption is calculated for several values of the outdoor temperature and multiplied by the number of hours in the temperature interval (bin) centered around that temperature. Bin data is defined as the number of hours that the ambient temperature was in each of a set of equally sized intervals of ambient temperature.
在稳态模型中,度日数法是最知名和最简单的方法。传统上,度日数法建立在一个长期平均的假设基础上。当室外日气温是18.3℃时,建筑日射和内部得热将抵消其热量损失。并且,能耗与差值(室外平均气温与18.3℃的差值)成比例。如果建筑的使用情况与空调系统设备足够稳定,度日数法能够十分准确地估算能耗。然而,在许多应用场合下,上述的参数中至少有一个逐时变化。比如,热泵系统的效率和HAVC设备可能直接或间接受室外气温的影响。在这种情况下,如果不同温度间隔和时间段分别估算,bin方法可以得到更好的年能耗结果。在bin方法中,能耗计算是取几个室外温度进行计算的,并且被这个温度为中心的温度区间的逐时数相乘。Bin数据定义为:环境温度在各自一系列相等的环境温度区间的小时数。
In the United States, the necessary bin weather data are available in the literature [2, 3]. Some researchers[4–8] have developed bin weather data for other regions of the world. However, there is a lack of information in the ASHRAE handbooks concerning the bin weather data required to perform energy calculations in buildings in China. The practice of analysis of weather data for the design of HVAC systems and energy consumption predictions in China is quite new. For a long time, only the daily value of meteorological elements, such as daily maximum, minimum and average temperature, was recorded and available in most meteorological observations in China, but what was needed to obtain the bin weather data, such as temperature bin data, were the long term hourly values of air temperature. The study of bin weather data is very limited in China. Only a few attempts [9, 10] in which bin weather data for several cities was given have been found in China. Obviously, this cannot meet the need for actual use and research. So, there is an urgent need for developing bin weather data in China. The objective of this paper, therefore, is to study the hourly measured air temperature distribution and then to establish a model to generate bin weather data for the long term daily temperature data.
在美国,必要的bin气象数据可以在文献中得到。一些研究人员已经为世界上其他地区发展了bin气象数据。然而,在包涵用于计算能耗的bin气象数据的ASHRAE手册中,没有关于中国的数据。为用于HAVC系统设计和能耗预算的气象数据进行分析的实践活动在中国还比较新。在很长的时期内,在中国大部分气象站,只有比如日最高最低和平均气温数据被记录下来,可以使用,但是为了得到bin气象数据(比如温度bin)而需要的数据是逐时空气温度。关于bin气象数据的研究在中国相当有限。在中国仅建立了相当少的试点,在这些试点中,给出了一些城市的bin气象数据。很明显,这不能满足实际应用和研究的需求。所以在中国发展bin气象数据的要求十分紧迫。因此,本文的目的就是研究逐时测量空气温度区间,进而为长期日气温数据建立模型产生bin气象数据。
2. Data used
2.使用到的数据
In this paper, to study the hourly ambient temperature variation and to establish and evaluate the model, a one year long hourly ambient temperature record for Nanjing in 2002 was used in the study. These data are taken from the Climatological Center of Lukou Airport in Nanjing, which is located in the southeast of China (latitude 32.0 N, longitude 118.8 E, altitude 9 m).
在本文中,为了研究逐时环境温度的变化以及建立和评价该模型,研究过程中用到了南京2002年一年内的逐时环境温度记录。这些数据取自南京路口风机场气象站,该气象站位于中国东南部,(北纬32.0℃,东经118.8℃,海拔9m)。
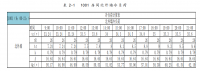
In addition, in order to create the bin weather data for Nanjing, typical weather year data was needed. Based on the long term meteorological data from 1961 to 1989 obtained from the China Meteorological Administration, the typical weather year data for most cities in China has been studied in our former research[11] by means of the TMY (Typical Meteorological Year) method. The typical weather year for Nanjing is shown in Table 1. As only daily values of the meteorological elements were recorded and available in China, the data contained in the typical weather year data was also only daily values. In this study, the daily maxi- mum and minimum ambient temperature in the typical weather year data for Nanjing was used.
另外,为了在南京创建bin气象数据,典型气象年的数据是必需的。以中国气象局字1961到1989年间长期的气象数据为依据,在我们先前的研究中,我们用典型气象年方法研究了中国大部分城市的典型气象年数据。南京典型气象年如表1所示。因为在中国只有每日的气象参数被记录和可用,故典型气象年包涵的数据也是每日的值。只这次研究中,用到了南京典型气象年中的最高和最低日环境温度。
3. Stochastic model to generate bin data
3.随机模型计算bin数据
Traditionally, the generation of bin weather data needs long term hourly ambient temperature records. However, in the generation, the time information, namely the exact time that such a temperature occurred in a day, was omitted, and only the numerical value of the temperature was used. So, the value of each hourly ambient temperature can be treated as the independent random variable, and its distribution within the daily temperature range can be analyzed by means of probability theory.
传统上,bin气象数据的产生需要长期的逐时环境温度记录。然而,在产生过程中,时间信息即某个温度发生的准确时间被忽略了。仅仅用到了气温的数值,每日的气温分布区间可以用概率论进行分析。
3.1. Probability distribution of normalized hourly ambient temperature
3.1 标准逐时温度概率区间
Since the daily maximum and minimum temperatures and temperature range varied day by day, the concept of normalized hourly ambient temperature should be introduced to transform the hourly temperatures in each day into a uniform scale. The new variable, normalized hourly ambient temperature is defined by
(1)
既然,最高和最低日气温和气温分布范围每天都在变化,故标准逐时环境温度的概念就应该被提出来,它可以将每天的逐时温度化到一个统一的标准形式。这个新变量,标准逐时环境温度定义为
(1)
where ^t may be termed the normalized hourly ambient temperature, tmax and tmin are the daily maximum and minimum temperatures, respectively, t is the hourly ambient temperature.
式中 为标准逐时环境温度,tmax和tmin 分别是最高和最低日气温,t是逐时环境温度。
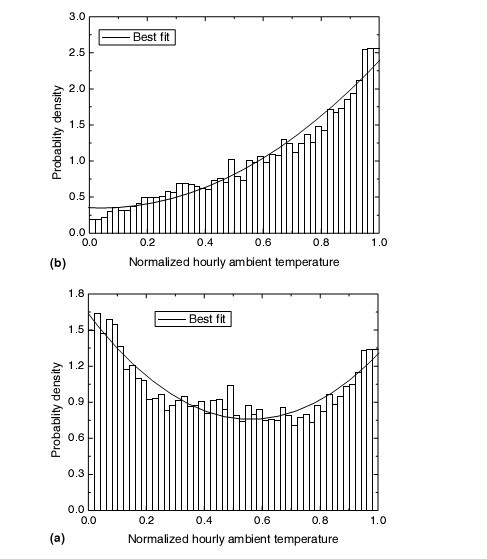
Obviously, the normalized hourly ambient temperature ^t is a random variable that lies in the interval [0, 1].To analyze its distribution, the interval [0, 1] can be divided equally into several subintervals, and by means of the histogram method [12], the probability distribution density of ^t in each subinterval can be calculated by
(2)
Table 1
The typical weather year for Nanjing
Month Year
January 1982
February 1987
March 1983
April 1987
May 1975
June 1964
July 1984
August 1968
September 1986
October 1984
November 1989
December 1982
很明显,标准逐时环境温度 的随机变化区间在[0,1]内,为了分析该分布状态,可以用柱状图方法将区间[0,1]划分为若干个相等的子区间,可以用下式计算各个子区间中 的概率分布密度。

微信

QQ1:3097331788 QQ2:2601997959 QQ3:2993773635